The results you are seeing are based on a follow up of a paper from Hai Liang and King-wa Fu. These scientists had the double aim of generalizing and testing ten propositions made in previous Twitter studies and developing an adequate and replicable sampling method to study computational social sciences. We used the same tweeter user IDs and we extracted tweets text using Twitter APIs. We took the dataset used in the mentioned paper containing the IDs for each tweet and extracted these IDs to a text file; only tweet IDs associated with english were kept. Then, we ran the tweet IDs through Hydrator to extract the text from each tweet. The output of the Hydrator was a JSON file containing most of the same information as in the timelines data used by the paper, but with the text of each tweet as well. After the hydrator, we kept around 66% of the tweets which amounted to 1.6 million tweets. Once we had the text of the tweets, there were still tweets that were still not in english, so we eliminated those tweets and ended with 1.1 millions tweets.
The tweets collected have been cleaned up and preprocessed with complex and annoying natural language python toolkits, but don’t worry we will not annoy you with those. Everything went well, trust us.
We labeled the tweets based on the sentiment they convey, as either positive, neutral or negative.
We used two sentiment-analysis models for this purpose:
- the Vader sentiment analyzer, which is a rule-based model published by C.J. Hutto and Eric Gilbert (2014);
- BERT, which is a more recent language model based on a large neural architecture that can be fine-tuned for several end tasks, including sentiment analysis.
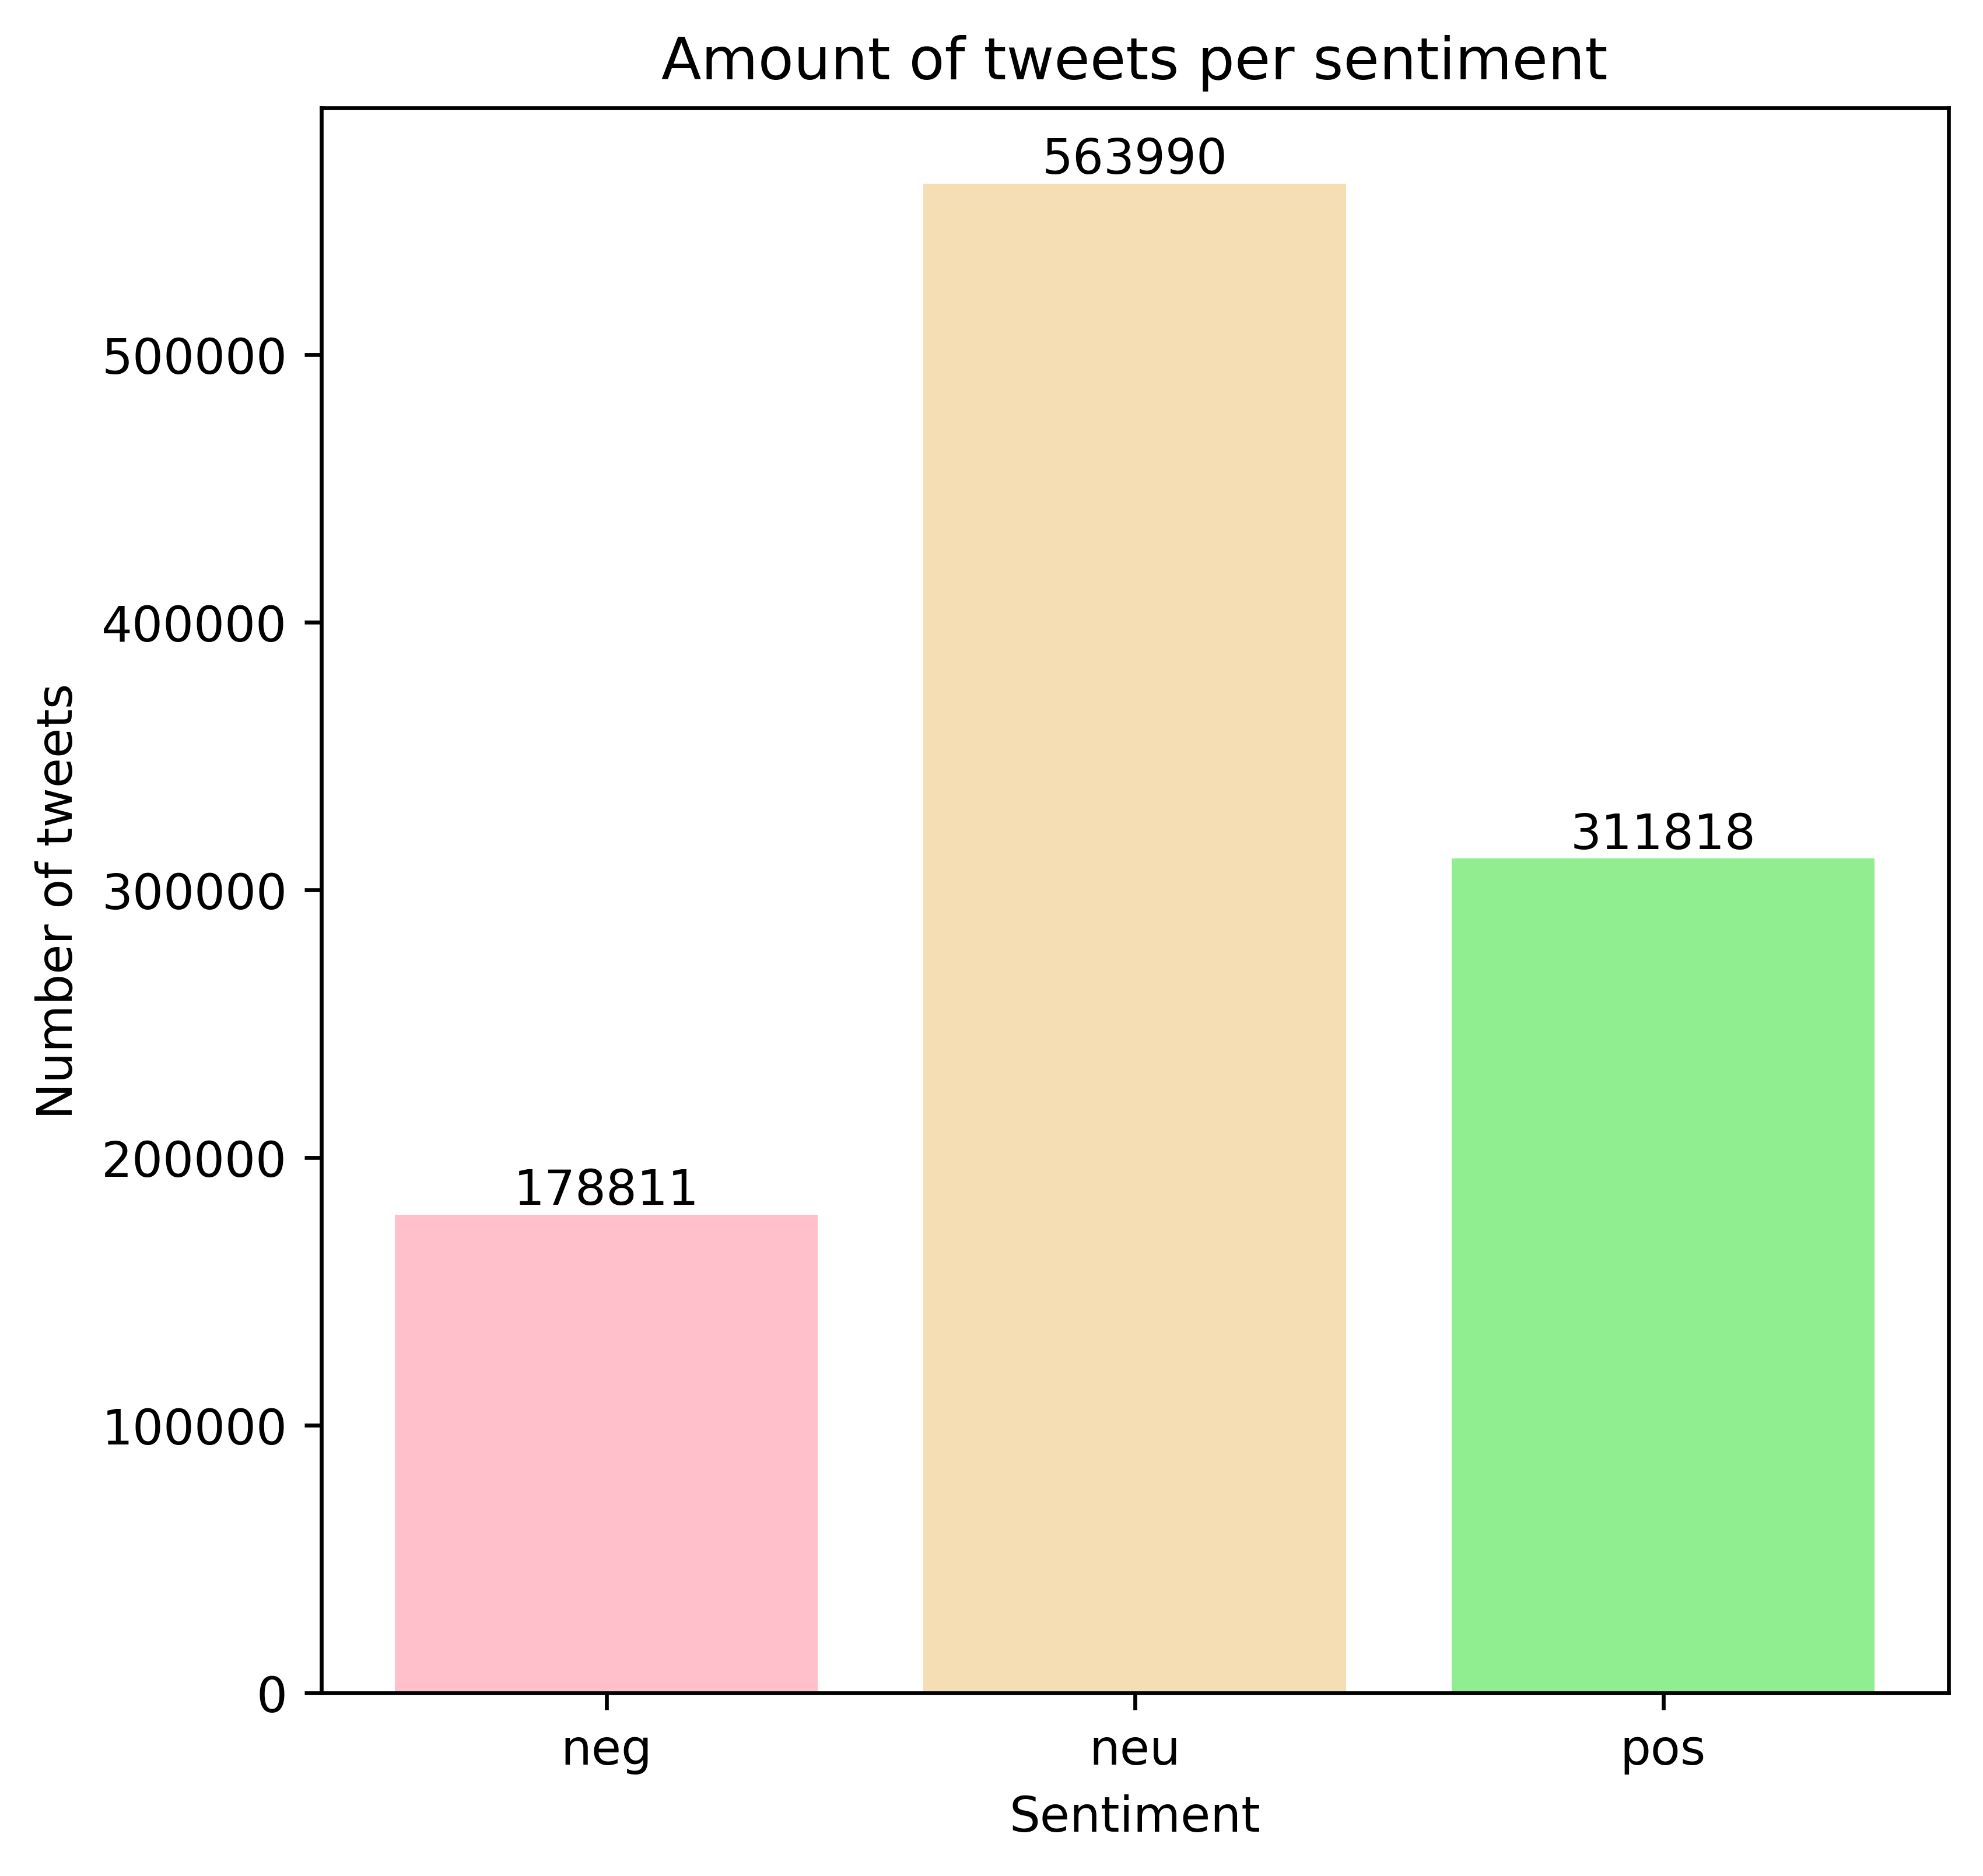
Vader assings a sentiment score to the text of each tweet, and then we can distinguish positive, negative and neutral tweets by setting a threshold on this score. The following plot shows the sentiment distribution as predicted by Vader.
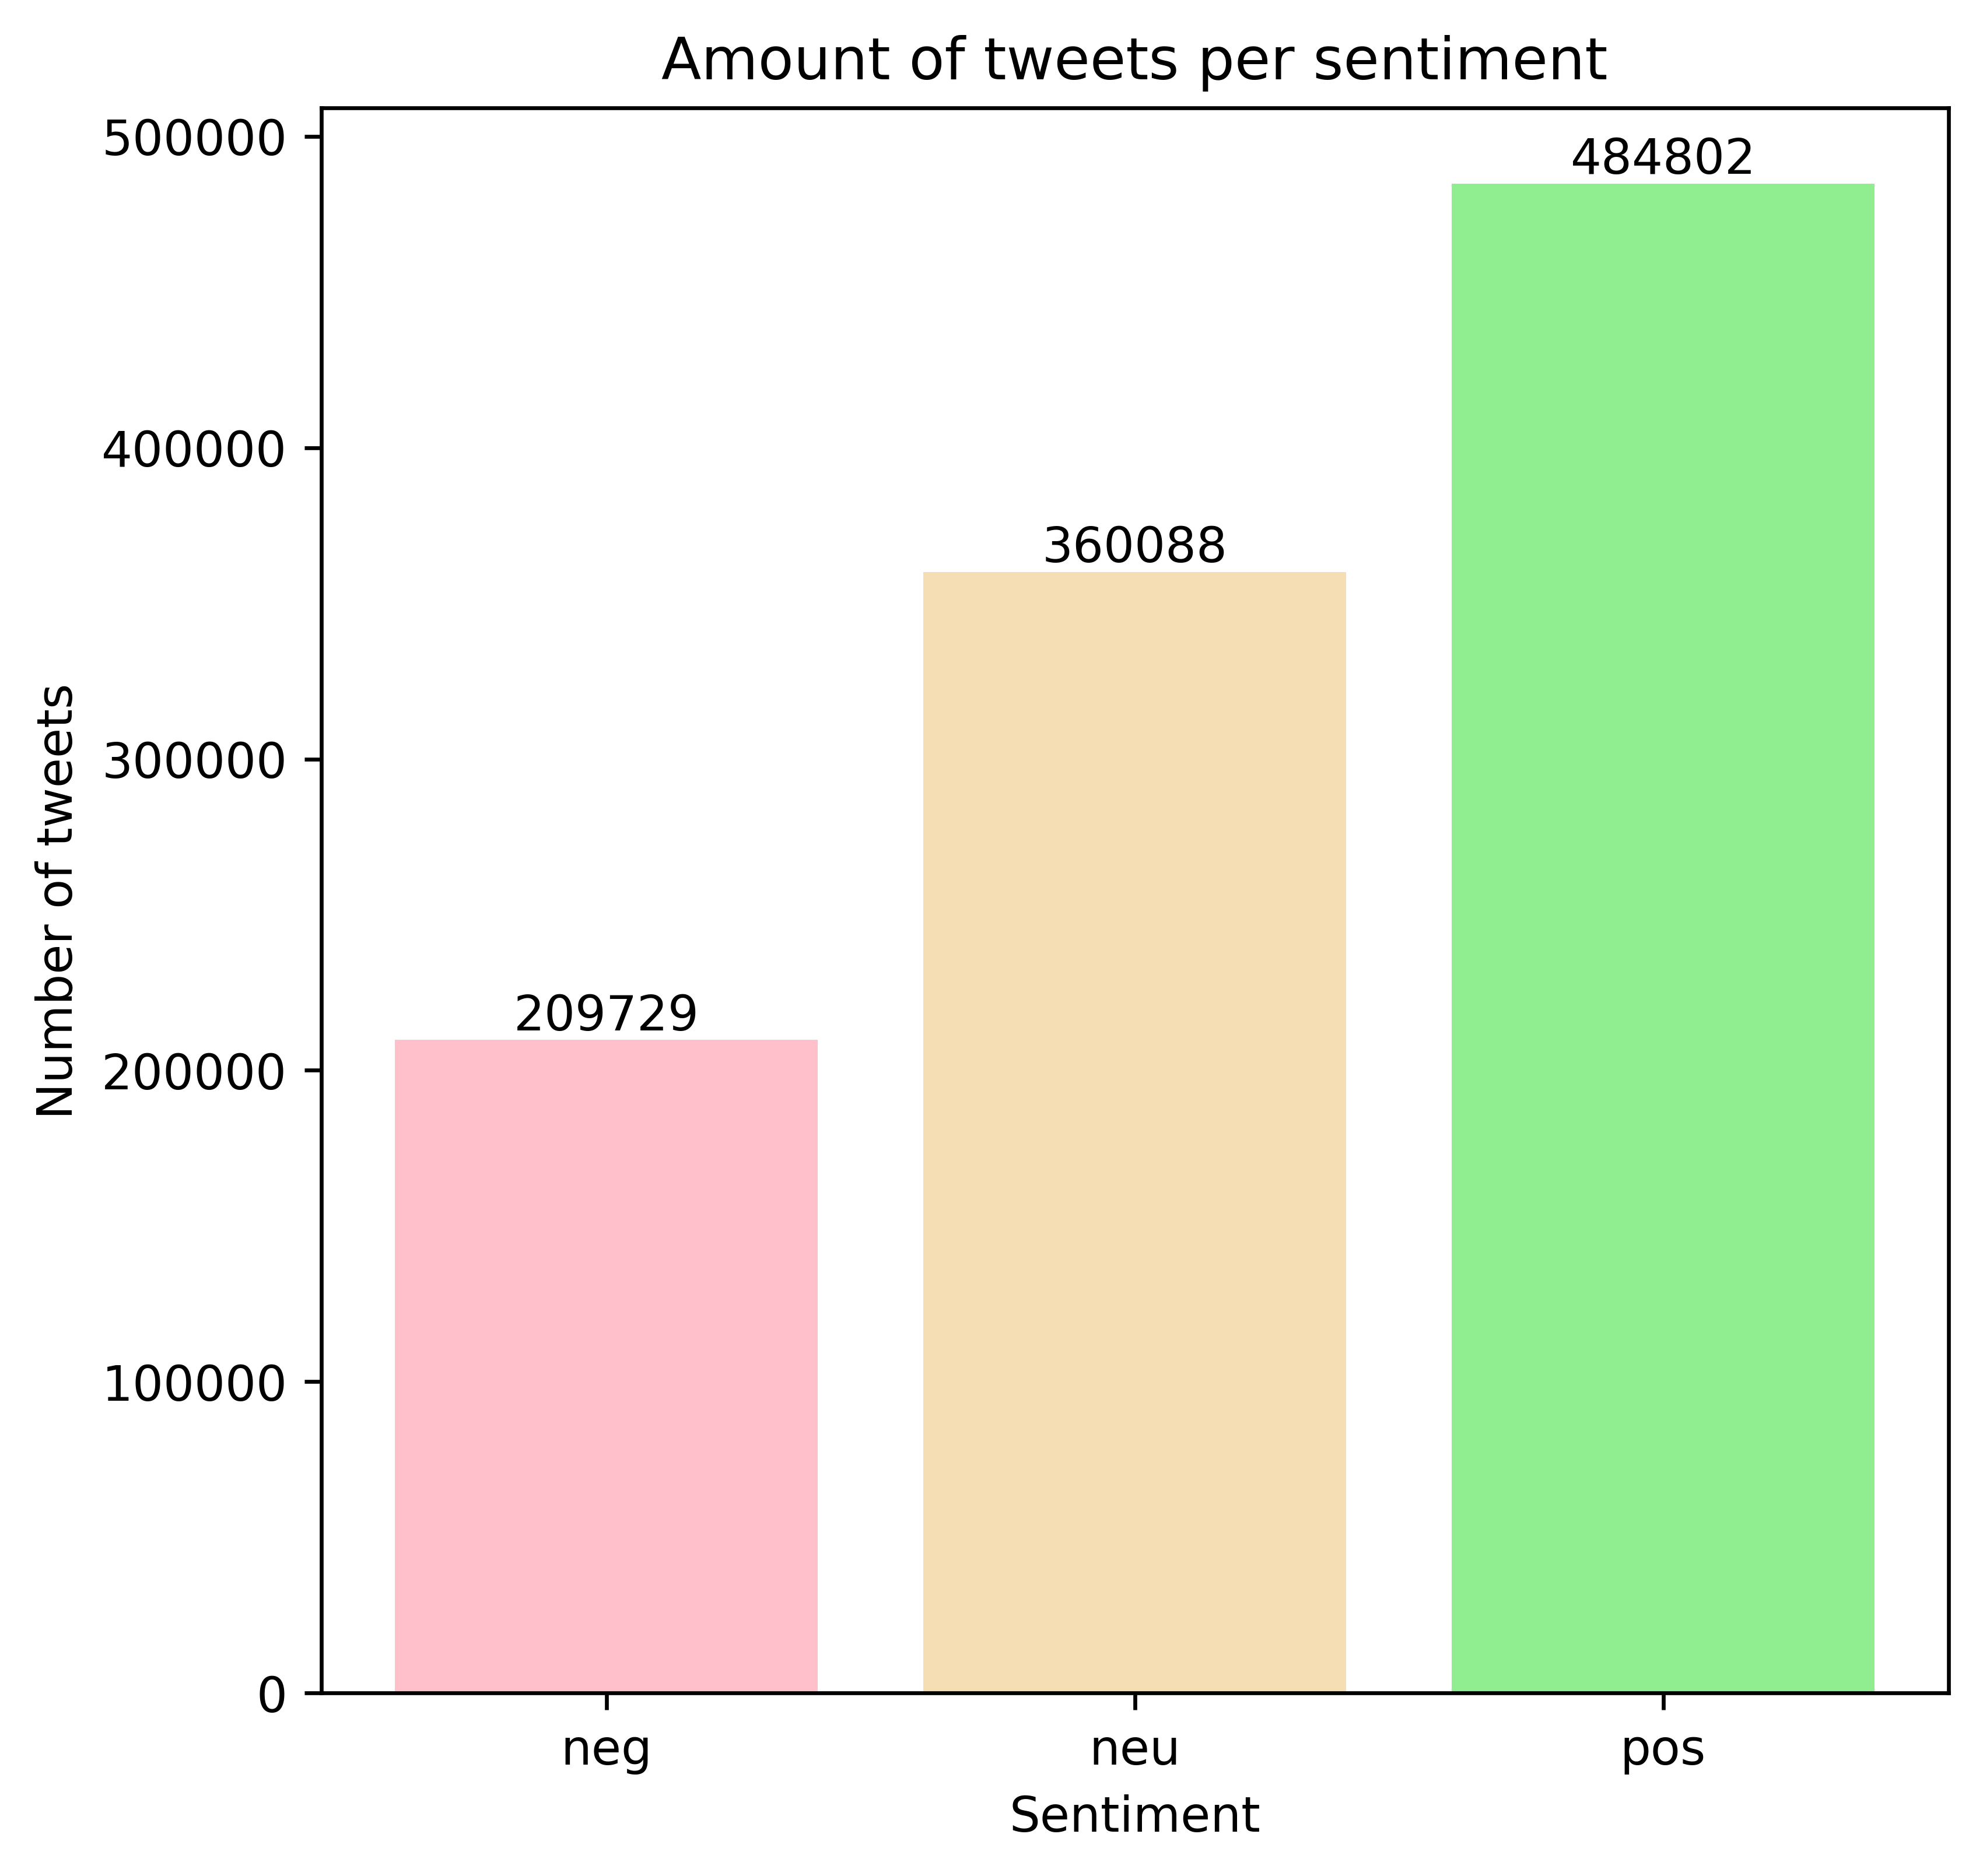
The sentiment-analysis model based on BERT is fine-tuned on a dataset with only positive and negative tweets. Hence, the model is not able to classify tweets as neutral. For this reason, we applied this model only on the tweets labeled by Vader as either positive or negative.
The distribution of sentiment labels predicted by the BERT-based model is shown below.
We see that the distribution of positive and negative tweets can be very different depending on the model. Let’s look in more details at the difference between the predictions made by BERT and Vader. The following plot shows the percentage of tweets that fall under each of the four possible combinations of label assingments by the two models.
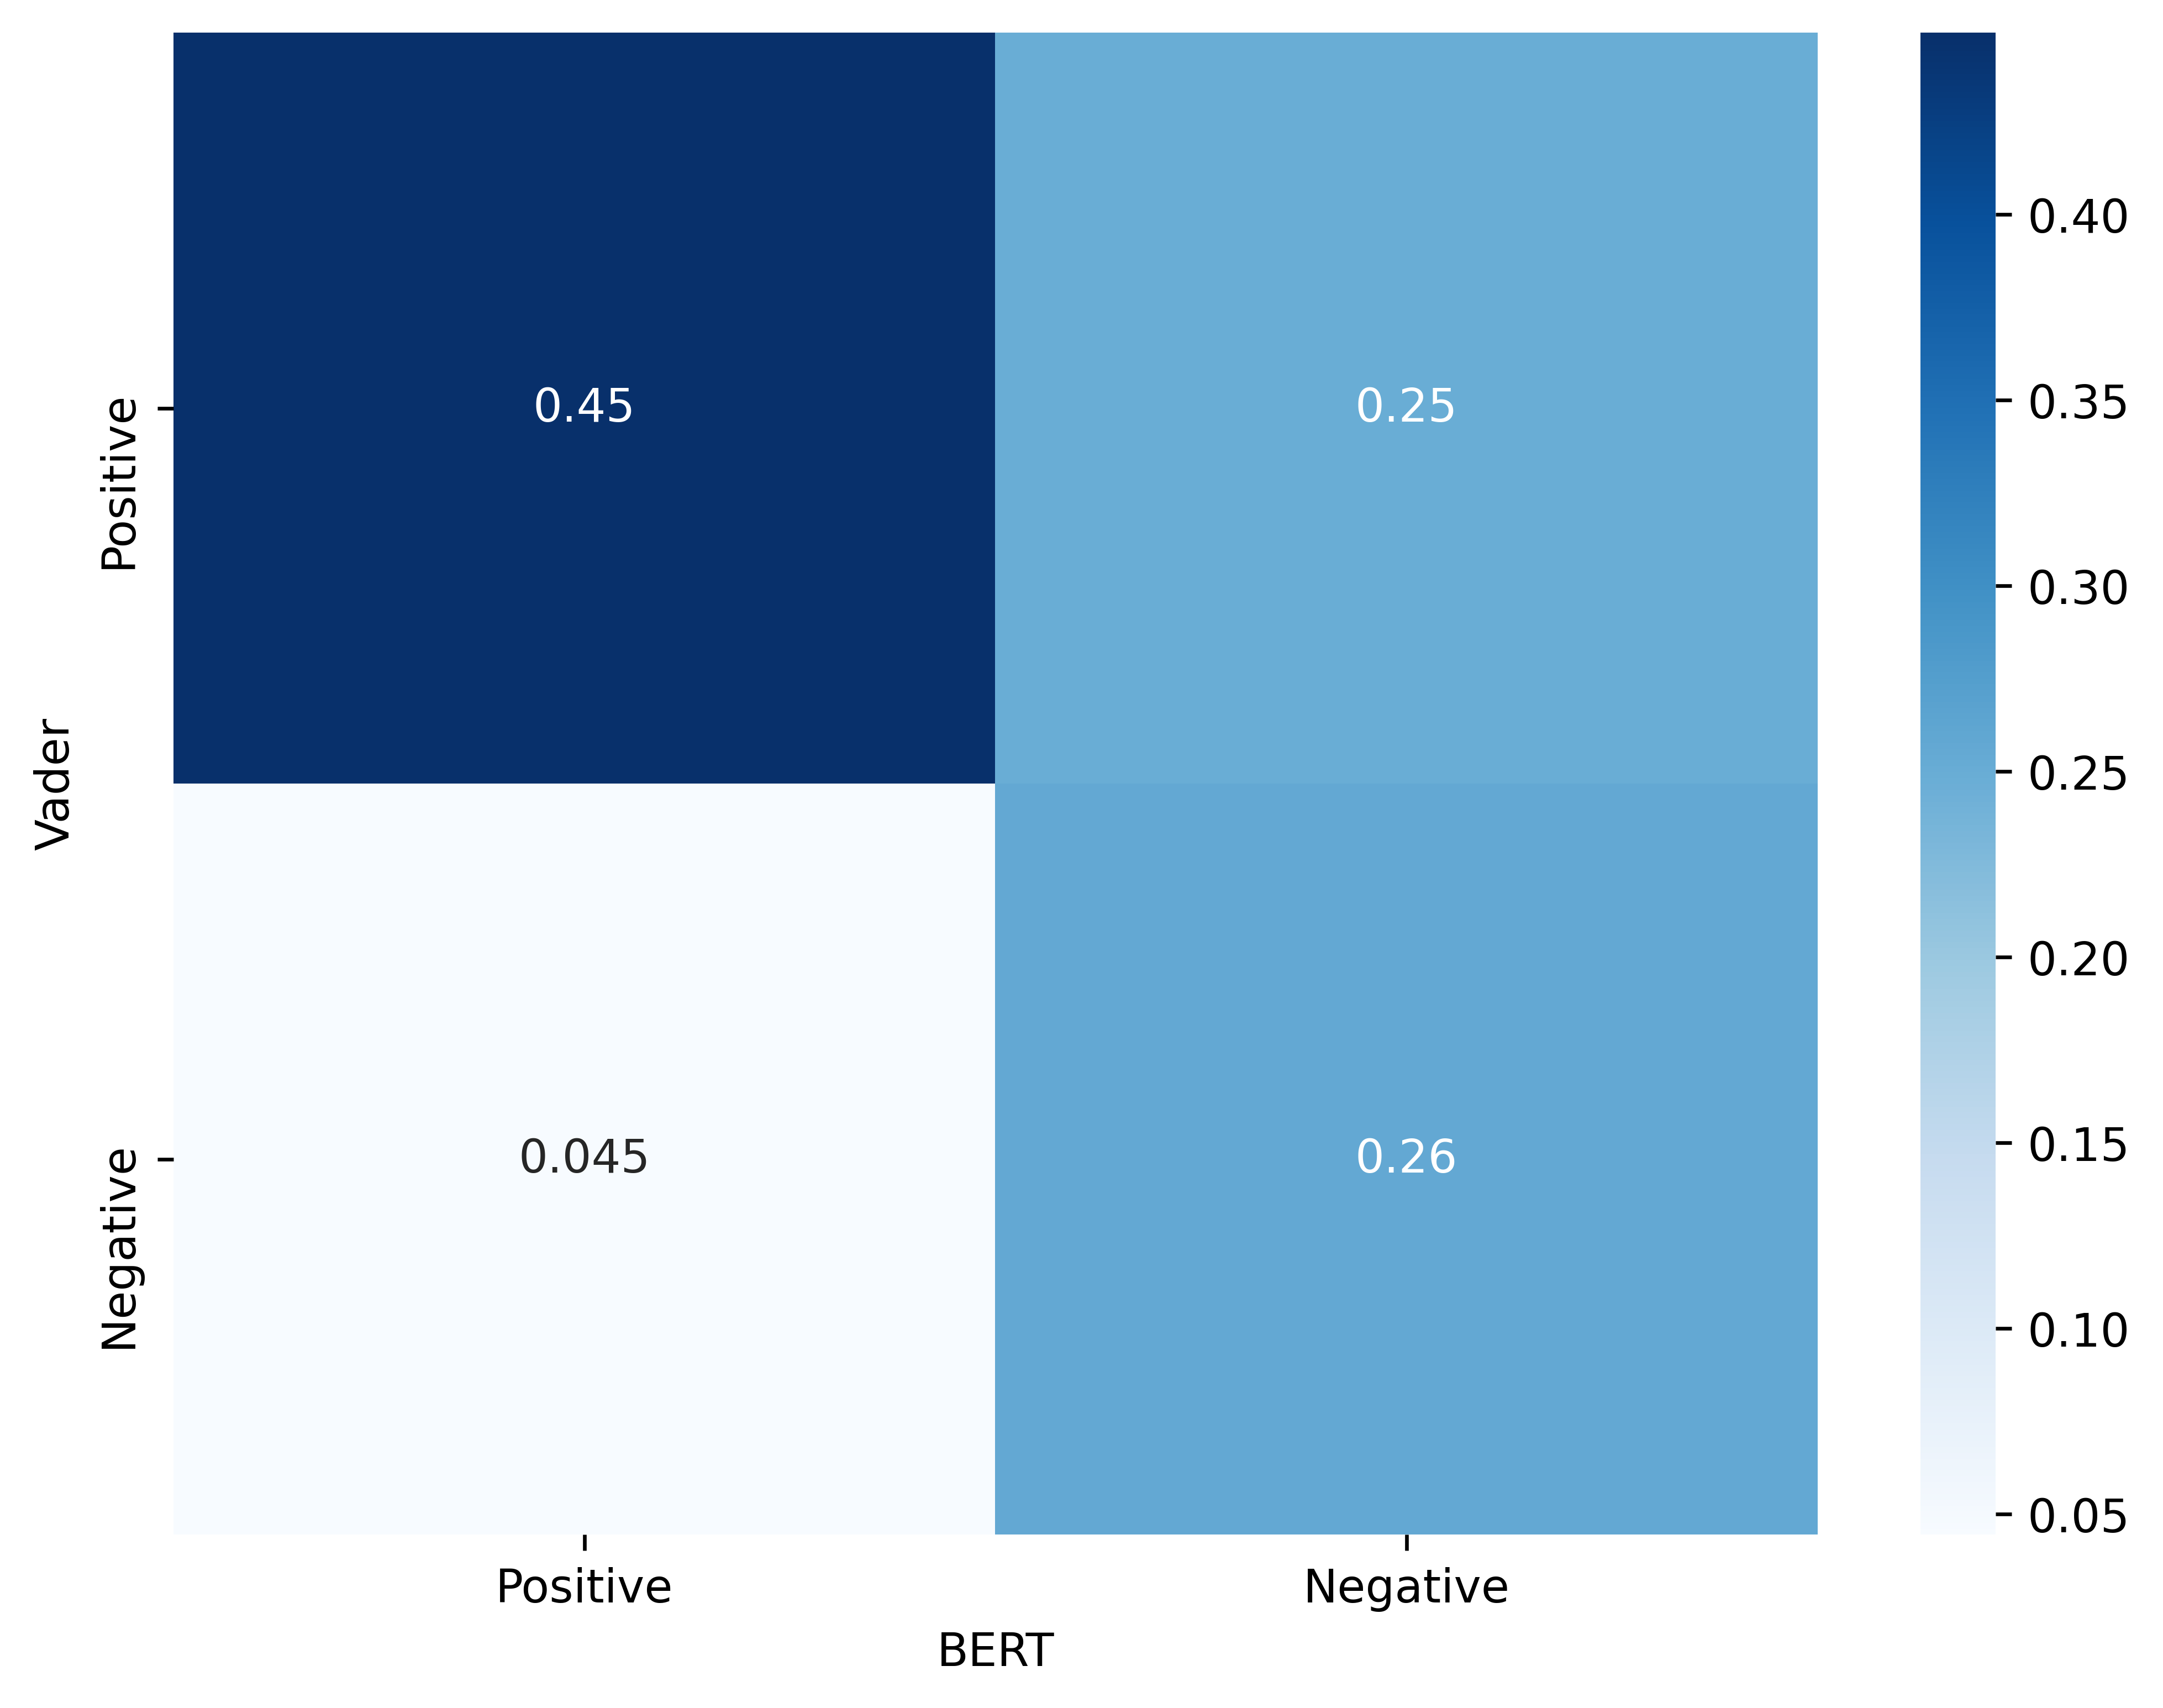
We see that, overall, the two models agree for approximately 70% of the tweets in the dataset.
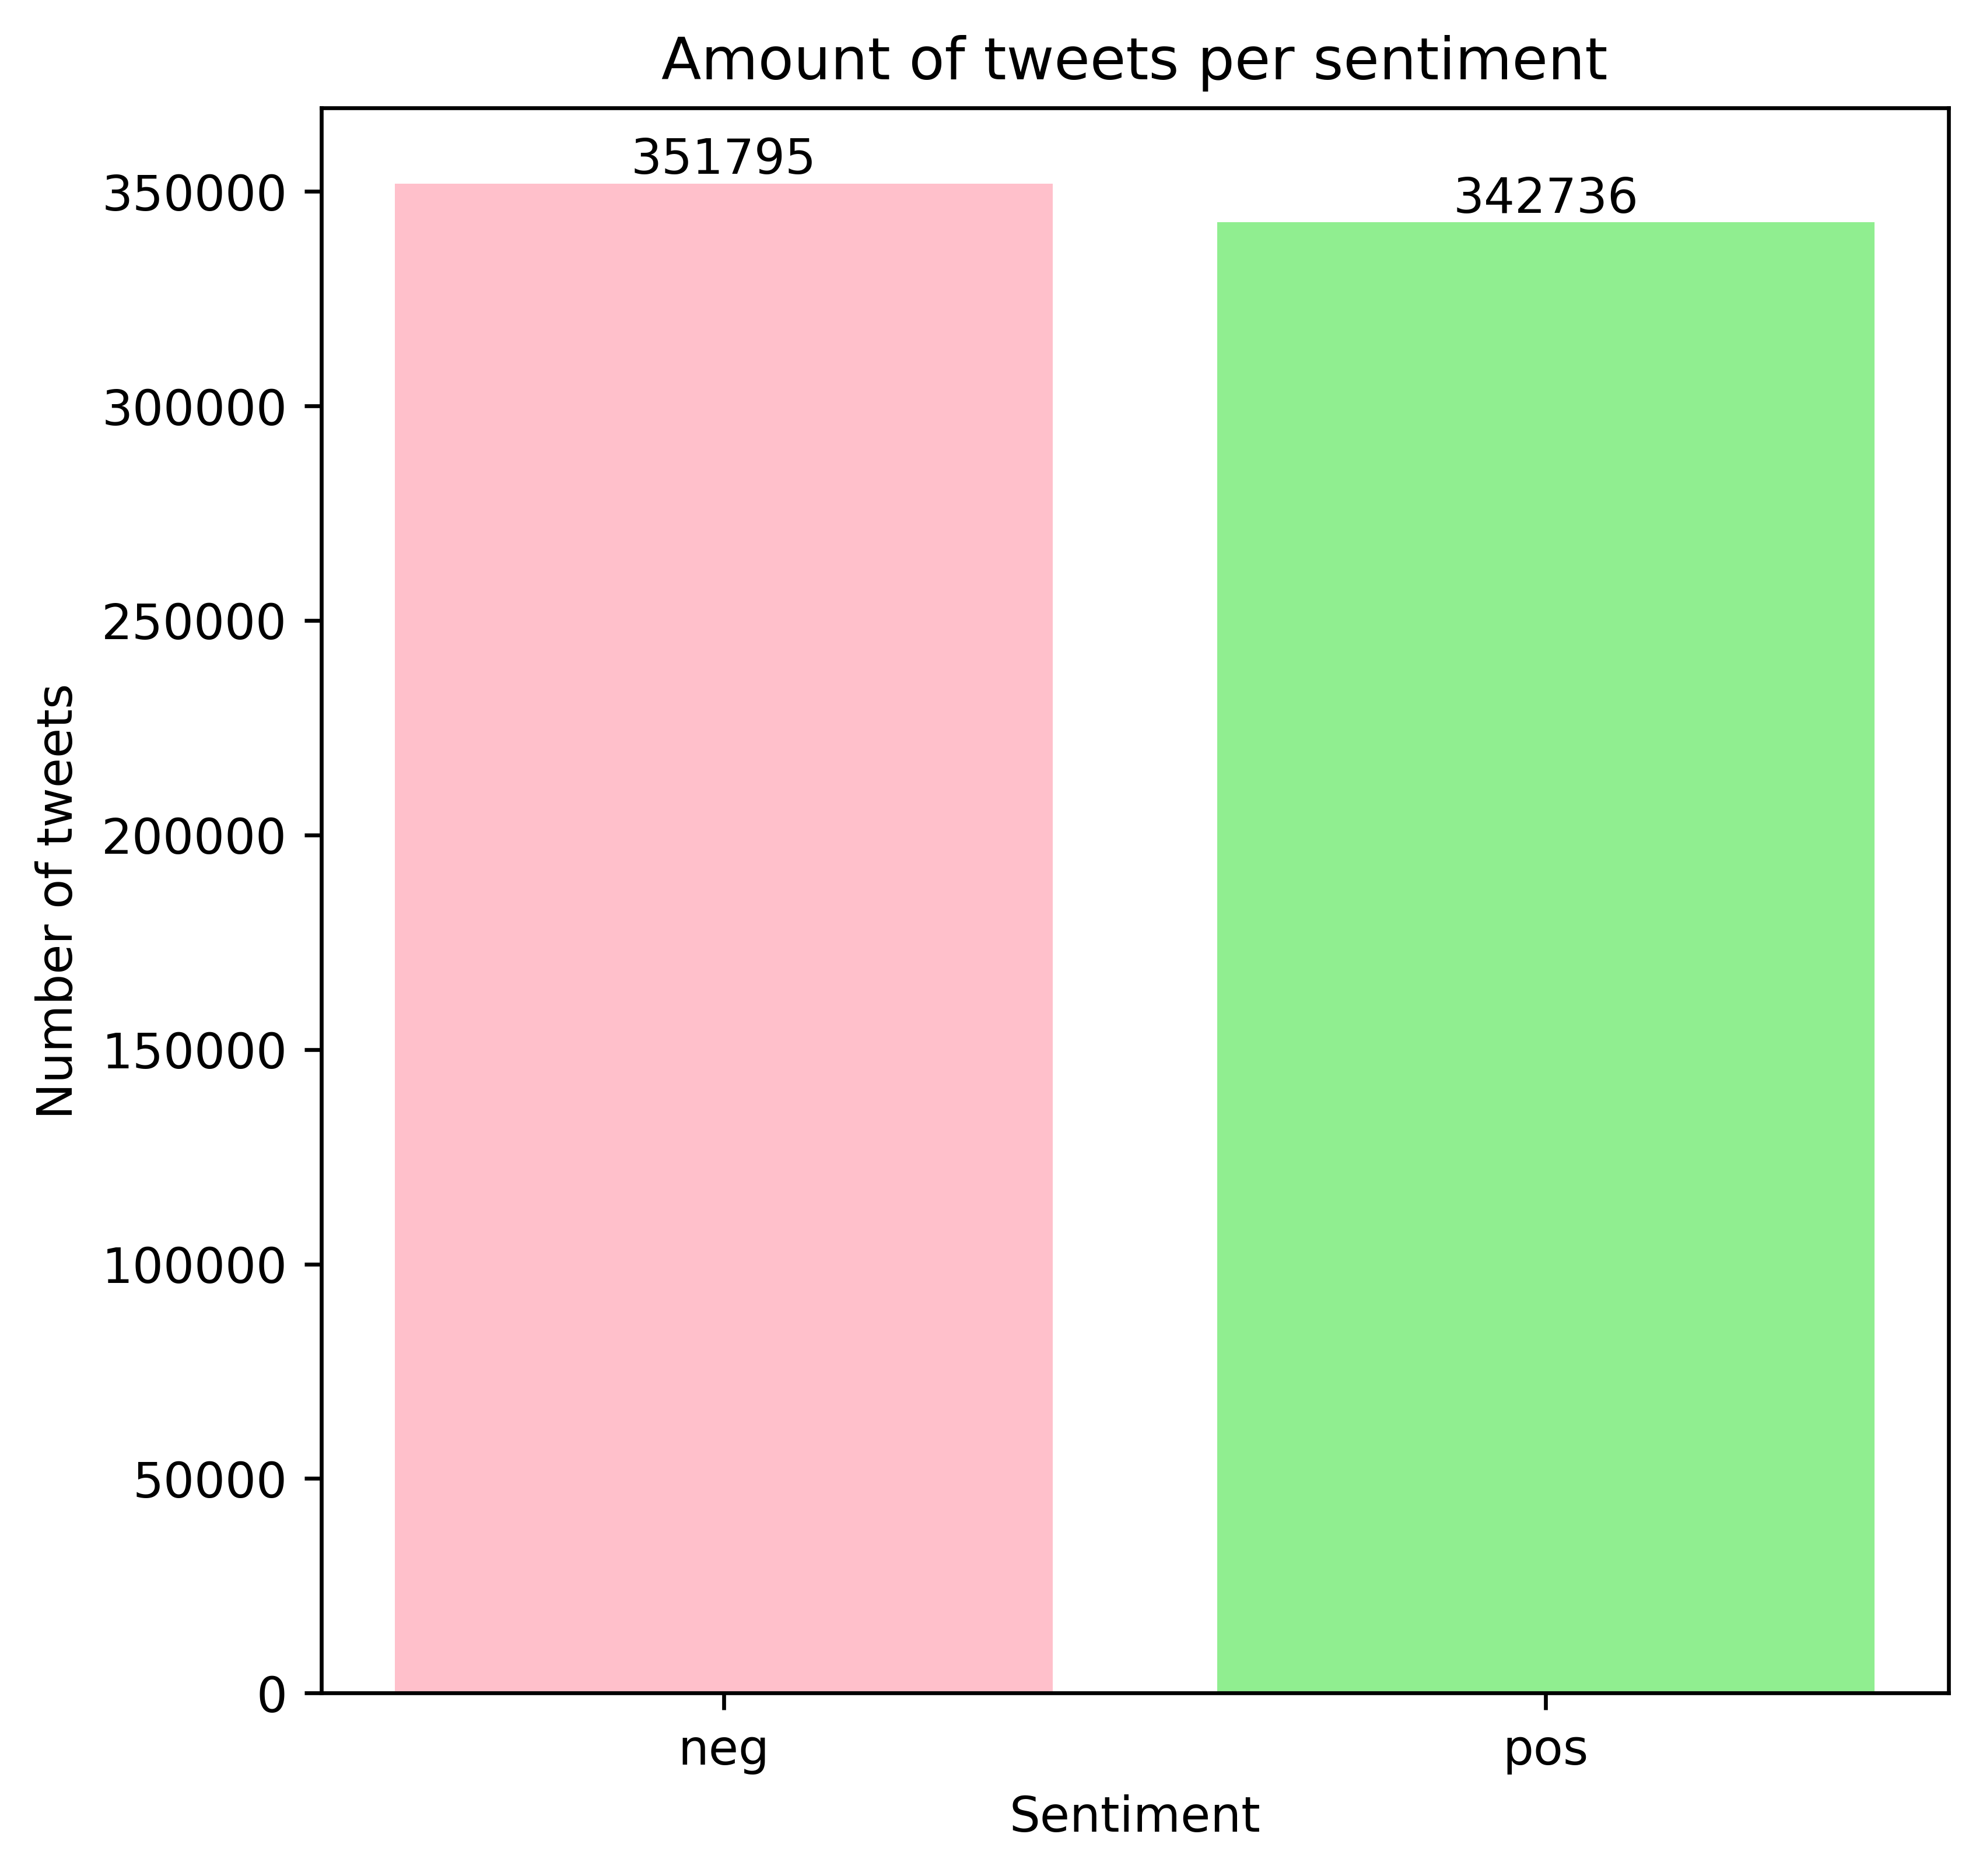
In order to maximize the precision of the labeling of positive and negative tweets, we consider a tweet as positive or negative only if the two models agree. In case of disagreement, the tweet is be labeled as neutral and will be disregarded in our analysis.
This yields the final distribution depicted in the plot below.